Manual
Here you can find a manual how the animations were created
- A suitable program is necessary for creating animations, we used the
Wolfram Mathematica.
- In animations is nothing modelled (the spacecraft flight, movements of planets, comets or asteroids), all positions are real obtained from
HORIZONS Web-Interface. It is a website maintained by NASA JPL (we thank them for providing these data).
- At the following picture you can see what settings to choose on HORIZONS Web-Interface:
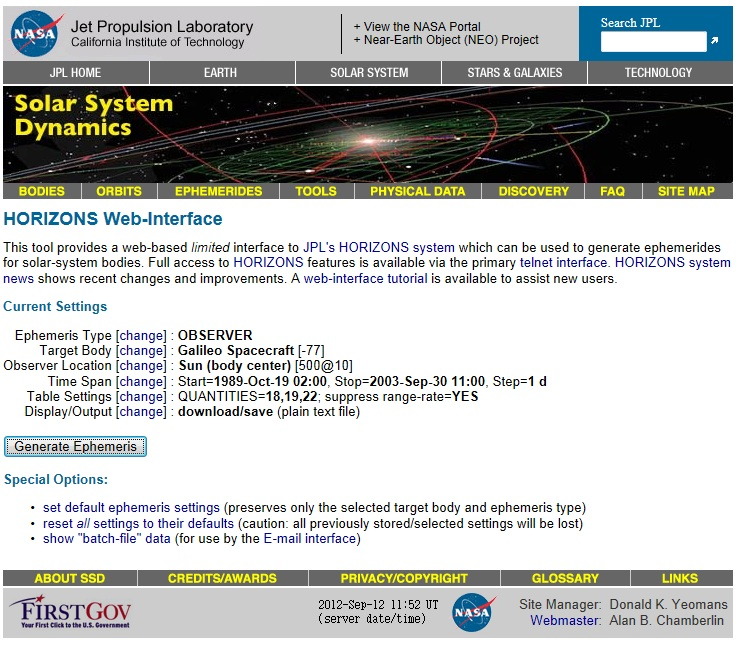
Ephemeris Type: OBSERVER
Target Body – we enter the names of spacecrafts, planets, comets, etc.
Observer Location: Sun (body center)[500@10] - with this setting we get the heliocentric (spherical) coordinates
Time Span – for a selected choice from Target Body
is always available information about possible time span, we can also choose the time step in
Step Size - 1 day is sufficient but you can choose smaller step
(smaller step means bigger size of the file and for the animation is 1 day nicely sufficient)
Table Settings: QUANTITIES=18,19,22; suppress range-rate=YES
-
the parameter 18 is for heliocentric longitude and latitude (Helio eclip. lon & lat),
19 for heliocentric radial distance (Helio range & rng rate),
with this setting we get another entry that is unnecessary so we get rid of it with the setting
suppress range-rate=YES
and the parameter 22 is for the speed with respect to the Sun and to the observer
(Speed wrt Sun & obsrvr) - but if we have set the Sun as the
Observer Location, then we obtain two identical columns, this setting
22 we can, of course, skip for planets, asteroids, comets - we don't need their speed
Display/Output: download/save (plain text file)
- After all settings we click on Generate Ephemeris and we save the generated file into the computer.
It is very important to choose appropriate names for files! For our names see
files of coordinates.
-
In all obtained text files we have to delete their beginnings and ends in the way that the files will contain only tables with data
(the very first entry in the file will be the date for the first position).
-
Now we are almost ready for importing the data into the program Wolfram Mathematica. We had some troubles with this and the solution was
the creating a special file for each coordinate, date and speed (the import is maybe possible from the original file which contains all columns,
in that case you can skip this step a we ask for sending the instruction). This part we can do for example with the program
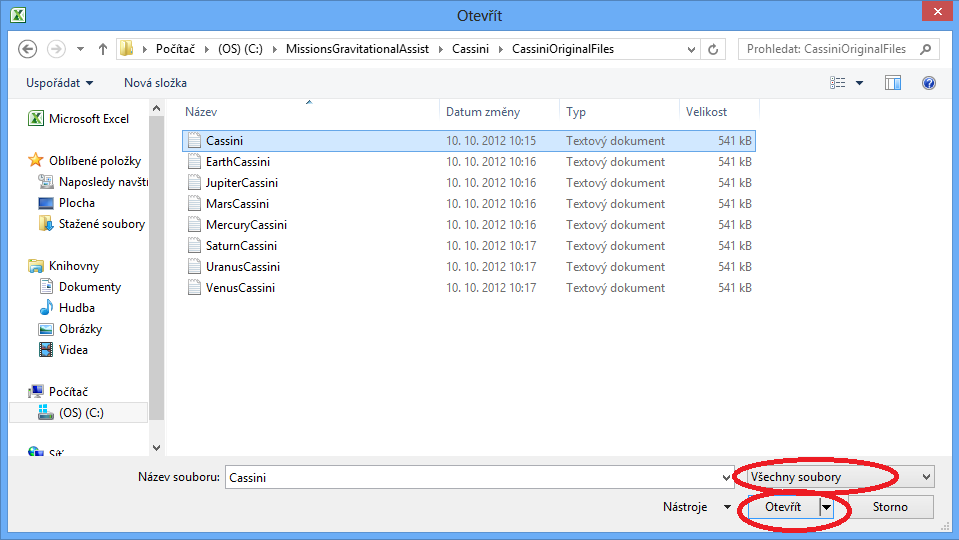
Microsoft Excel this way (unfortunately, we don't have English version of that program,
so the pictures are from Czech version but we hope that it is clear enough):
a) select Open – All files
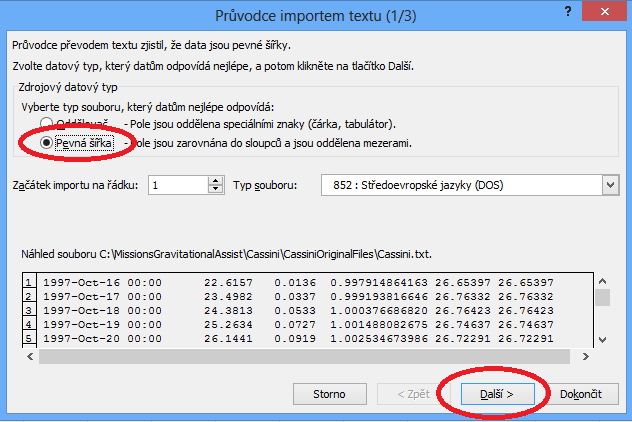
b) Original data type - Fixed width, Next,
on the second screen of the Text Import Wizard we do nothing and just press Next
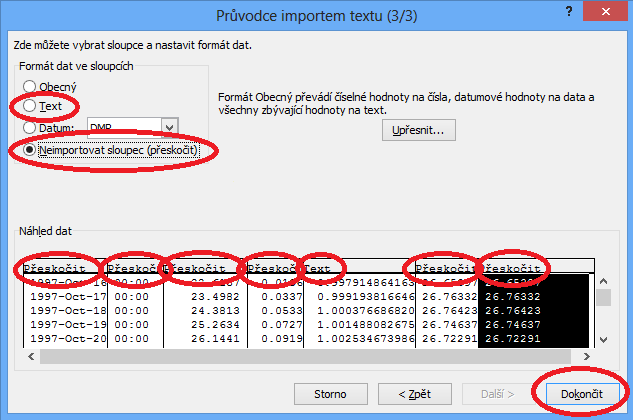
c) for a selected column which we want to separate we choose
Column data format – Text, for other columns we choose
Do not import column (skip) and press Finish
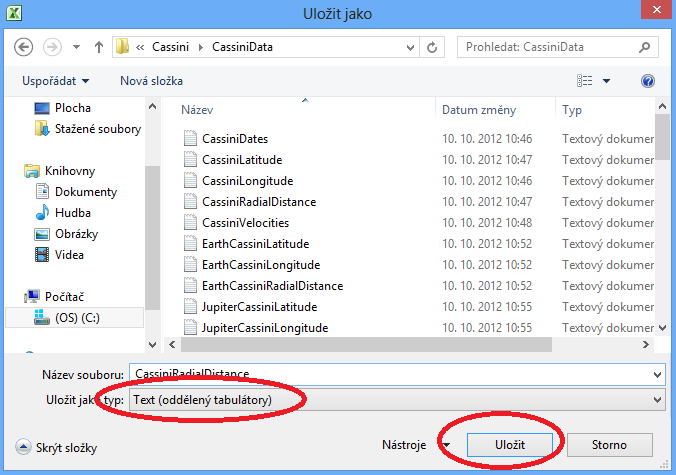
d) an imported column we save as a type
Text (tab delimited), Save
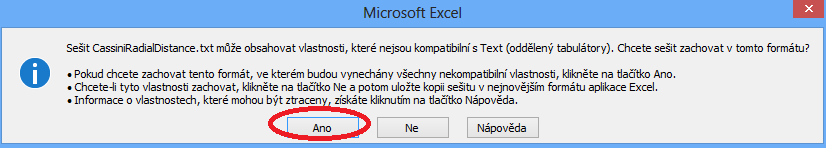
e) on the next warning we press
Yes
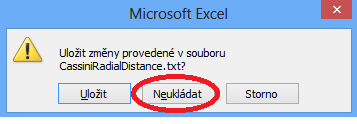
f) and when closing the Excel we press Don't save
g) This procedure we do for all columns which we want to import into the program Wolfram Mathematica - for the probe, all needed planets, comets, asteroids.
This step is definitely the most laborious, on the other hand you don't have to do it - you can use our
files of coordinates.
- Before making an animation it is better to transform the heliocentric spherical coordinates into the heliocentric Cartesian coordinates
(Wolfram Mathematica can make plots from spherical coordinates but plotting takes longer time for an appropriate command than plotting from Cartesian coordinates)
- for that purpose we use the famous coordinate transformation:
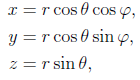
where r is the Radial Distance, θ Latitude and φ Longitude.
The calculation can be done in the program Wolfram Mathematica and the results can be exported as text files.
In the files of coordinates
you can find in the appropriate folder for the selected mission the file with the name e.g. "DawnCartesianCoordinates.nb",
with the help of that file were transformations and exports done.
-
Now we have finally everything ready for importing data into the program Wolfram Mathematica. We did the import with commands
OpenRead and ReadList
(the command Import
was useless because the computer usually stopped working).
For this purpose you can find in the
files of coordinates in the appropriate folder
for the selected mission the file with the name e.g. "DawnDataImport.nb", with the help of that file was the import done.
Important notice: everything will work only in case you place the folder after unpacking on the disc C: and you do not change its name
(if you want to place it somewhere else or you do not have a disc denoted as C, you will have to edit the paths to files in .nb files, the structure is the following:
C:\\MissionsGravitationalAssist\\NewHorizons\\NewHorizonsData\\NewHorizonsDates.txt).
-
Which commands we used for making the animations you can find in the
source codes
- the files .nb of the program Wolfram Mathematica with them were the animations made.
And now you have two options - you can use the file for importing data "DawnDataImport.nb" every time you do changes in the animations and in the command for the animation
you use the setting SaveDefinitions->True
or you import the data into the command for the animation in the Initialization part.
In this case the file will be bigger, you can reduce the size with the command
Compress and than you load the data in the Initialization part
with the command
Uncompress - see the
source codes.
-
If any part is not clear, this manual doesn't work, or you know about better (simpler) way how to create such animations, please, don't hesitate and contact me.
Spacecraft Flights
Tidal Effects
