The whole sky as observed in different astronomical wavebands. In each
image, the plane of our Galaxy lies along the centre of the image and the
direction of the center of our Galaxy lies in the centre of each diagram.
This form of projection is known as an Aithof projection and in it equal
areas on the surface of the celestial sphere are preserved but the
orthogonality of the coordinate system is distorted away from the Galactic
equator. The coordinate system shown is known as Galactic coordinates. The
north and south galactic poles (b = + and - 90 degree) are at the top and
bottom of each diagram. The scale of Galactic longitude runs from 0 at the
centre, through +180 at the left of each image and then from +180 at the
right to 360 (or 0) degree at the centre.
|
 |
Intensity of radio continuum emission from surveys with
ground-based radio telescopes (Jodrell Bank MkI and MkIA, Bonn 100 meter,
and Parkes 64 meter). At this frequency, most of the emission is dominated
by the radio emission of relativistic electrons gyrating in the
interstellar magnetic field, the proces known as synchrotron radiation.
The radiation is most intense in the plane of the Galaxy but it can be
seen that there are extensive loops and filaments of radio emision
extending far out the plane. The large arc apparent near the center of the
image is known as the North Polar Spur or Loop I, and is the remnant
plasma from a supernova explosion that occurred thousands of years ago
relatively close to the Sun (on the scale of the Milky Way). Near some
discrete sources, such as the young supernova remnant Cas A near 110
degrees longitude, a significant fraction of the emission also comes from
electrons accelerated in strong magnetic fields.
At high Galactic
latitudes, there is a radio background component, most of it associated
with the Galactic disc and the halo of the Galaxy but some of it
associated with an isotropic component of diffuse radiation. In addition,
at high Galactic latitudes, there are many discrete radio sources, some of
which are visible on this image. The vast majority of these sources are of
small angular diameter. If a survey of discrete radio sources is made,
their distribution is found to be isotropic and integrated intensity of
these sources can accont for the isotropic background radiation at long
radio wavelengths. |
 |
Column density of neutral atomic hydrogen, derived on the
assumption of optically thin emission, from radio surveys of the 21-cm
transition of hydrogen. The 21-cm emission traces the "warm" interstellar
medium, which on a large scale is organized into diffuse clouds of gas and
dust that have sizes of up to hundreds of light years. The data shown here
are a composite of several surveys with ground-based telescopes in the
northern and southern hemispheres. |
 |
Column density of molecular hydrogen inferred from the
intensity of the J = 1-0 line of carbon monoxide, a standard tracer of the
cold, dense parts of the interstellar medium. Such gas is concentrated in
the spiral arms in discrete "molecular clouds." Most molecular clouds are
sites of star formation. The molecular gas is predominantly H2,
but H2 is difficult to detect directly at interstellar
conditions and CO, the second most abundant molecule, is observed as a
surrogate. The data shown here are a composite of surveys taken with twin
1.2-m millimeter-wave telescopes, one in New York City and the other on
Cerro Tololo in Chile. The black areas away from the plane were not
observed systematically, but little CO emission is likely to have been
missed. |
 This image of the sky
was made by the COBE satellite which made a complete map of the sky at 53
GHz (5.7 mm). The image is a differential map in the sense that all the
intensities are measured relative to the mean temperature of the Microwave
Background Radiation at a fixed point in the sky which has brightness
temperature 2.736 K. The color coding of the temperature scale corresponds
to a diference between the maximum and minimum temperatures. Blue
corresponds to 2.724 Kelvin and red is 2.732 Kelvin. This image of the sky
was made by the COBE satellite which made a complete map of the sky at 53
GHz (5.7 mm). The image is a differential map in the sense that all the
intensities are measured relative to the mean temperature of the Microwave
Background Radiation at a fixed point in the sky which has brightness
temperature 2.736 K. The color coding of the temperature scale corresponds
to a diference between the maximum and minimum temperatures. Blue
corresponds to 2.724 Kelvin and red is 2.732 Kelvin.
The Galactic plane
can be seen, the radiation being associated with free-free emission (or
bremsstrahlung) of extensive regions of ionized hydrogen. The image is
dominated by the dipole component which is hottest in the direction l =
270, b = 30 and coolest in the direction l = 90, b = -60. The amplitude of
this dipole component amounts to a temperature fluctuation of deltaT/T =
0.001. The amplitude can be wholly attributed to the motion of Earth
through the frame of reference.
The bottom
figure shows the microwave sky after the dipole anisotropy has been
subtracted from the map. This removal eliminates most of the fluctuations
in the map: the ones that remain are thirty times smaller. On this map,
the hot regions, shown in red, are 0.0002 Kelvin hotter than the cold
regions, shown in blue.
There are two main sources for the
fluctuations seen in the last figure:
1. Emission from the Milky Way
dominates the equator of the map but is quite small away from the equator.
2. Fluctuating emission from the edge of the visible universe dominates
the regions away from the equator.
There is also residual noise in the
maps from the instruments themselves, but this noise is quite small
compared to the signals in these maps. |
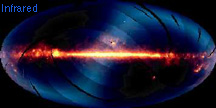 |
Nearly the entire sky, as seen in infrared wavelengths and
projected at one-half degree resolution, is shown in this image, assembled
from six months of data from the Infrared Astronomical Satelite (IRAS).
The bright horizontal band is the plane of the Milky Way, with the center
of the Galaxy located at the center of the picture. (Because of its
proximity, the Milky Way dominates our view of the entire sky, as seen in
this image. IRAS data processed to show smaller regions of the sky,
however, reveal thousands of sources beyond the Milky Way.) The colors
represent infrared emission detected in three of the telescope's four
wavelength bands (blue is 12 microns; green is 60 microns, and red is 100
microns). Hotter material appears blue or white while the cooler material
appears red. A broad band of radiation can be observed stretchong across
the map from top right to bottom left. This is thermal radiation of
zodical dust which is dust lying in the ecliptic plane of our Solar System
and which is heated by the Sun. Celestial objects visible in the photo are
regions of star formation in the constellation Ophiucus (directly above
the galactic center) and Orion (the two brightest spots below the plane,
far right). The Large Magellanic Cloud is the relatively isolated spot
located below the plane, right of center. Black stripes are regions of the
sky that were not scanned by the telescope in its first six months of
operation. |
 |
Composite near-infrared intensity observed by the Diffuse
Infrared Background Experiment (DIRBE) instrument on the Cosmic Background
Explorer (COBE) in the 1.25, 2.2, and 3.5 µm wavelength bands. The images
are encoded in the blue, green, and red color ranges, respectively. Most
of the emission is from cool, low-mass K stars in the disk and bulge of
the Milky Way. Interstellar dust does not strongly obscure emission at
these wavelengths; the maps trace emission all the way through the Galaxy,
although absorption in the 1.25 µm band is evident toward the Galactic
center region. |