DynSpe DynamicSpectrum class description
class DynamicSpectrum(outname = "dynamicspectrum.png")
initializes the class and sets name for output file
function add_LST(name, pref, folder="./", col=-2, headerrows=8)
add a file containing names of individual files and times of observations
name (str) - name of the file
pref (str) - the file names should be in format of pref+$1
folder (opt, str) - name of the folder if the files are in a different folder than script, default "." (current folder)
col (opt, int) - column where the observation times can be found - default -2 (second to last)
headerrows (opt, int)- skip a number of rows from the begining
function set_wlmid(value)
central wavelength of the spectrum
value (opt, float) - on initialization set to 6562.81 - H alpha
function set_toRV(value=True)
data will be displayed as linear in radial velocity from central point
value (opt, boolean) - on initialization set to False
function set_xvalrange(value)
sets interval of values around central line (either interval of wavelength or velocity depending whether is set to WL or RV)
value (float)
function set_xvalrange(value)
set step in x to interpolate the spectra to
value (float)
function set_nrlevels(value)
set number of color steps
value (int)
function set_period(value, digits=-1)
display the image as linear in orbital phase
value (float) - orbital period, default is None (display linearly in time)
digits (opt, int) - if set to > 0 then the value will be displayed in the top right corner up to digits number of digits
function set_T0(value, digits=-1)
set begining of ephemeris if orbital phase is to be computed
value (float) - epoch begining, default is None (display linearly in time)
digits (opt, int) - if set to > 0 then the value will be displayed in the top right corner up to digits number of digits
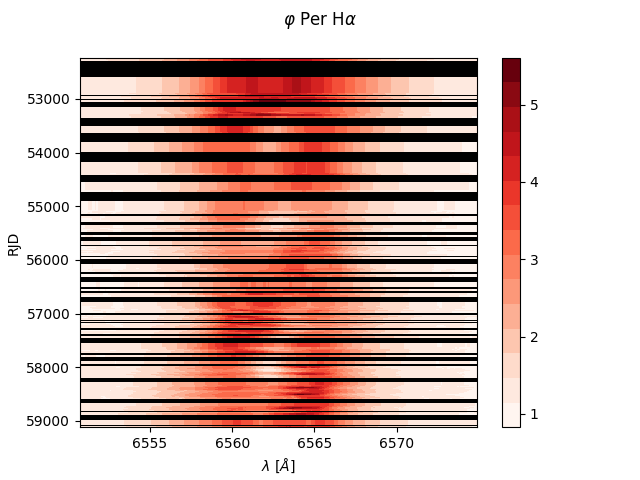
function set_title(value)
set title
value (str) - name of the dynamic spectrum - for greek letters use raw string
function set_emptyColor(value)
set color of empty space
value (str)
function set_zeroPhaseColor(value)
set color of zero-phase marker
value (str)
function set_cmap(value)
set colormap for the dynamic spectrum
currently there are 3 sequential (Reds, Blues, Greys) and one diverging (RdBu) colormaps implemented with their reverse (ie. Reds_r)
sequential colormaps are better suited for spectra which are either fully in emission (>1) or absorption (<1)
diverging colormap are better suited for spectra with both emission and absorption component
value (str) - colormap
function set_midpoint(value)
set midpoint of diverging colormap
value (float) - default is 1. (continuum)
function add_cmap(cmap, cmclass)
add and set a colormap predefined in matplotlib
cmap (str) - name of colormap
cmclass (str) - colormap class, either "Sequential" or "Diverging"