
We are also going to analyse J7/3 resonance in the same way. It is located at 2.96 AU and sharply bounds the Eos family. Large (observable) asteroids should NOT cross this strong resonance, while some fraction of small (R < 2 km) might cross it.
Initial conditions: NTP = 400; osculating elements: a = 3.023 - 3.025 AU, e = 0.03 - 0.12, sin i = 0.16 - 0.20 (in proper element space, the distribution is slightly more dispersed), random omega, Omega, and M;
Thermal parameters: radii (bins of 50 TP): 1.5, 3, 4.5, 6, 7.5, 9, 10.5, 12 and 15 km; bulk density 2500 km/m3, surface density 1500 km/m3, thermal conductivity 0.001 W/K/m, thermal capacity 680 W/kg/K, albedo 0.10, infrared emissivity 0.90, rotation periods 4 - 12 hr, obliquity 45° (ie. drifting outwards).
List of Figures and Tables:
(Rem. these jobs are quite time consuming - they last typically 1-1.5 Gyr -
and we have not completed all of them yet; consider the information
below as a first information only)
Figure 1 - Mean a(t) plot for R=3 km bodies. Approx. 50 % of them cross the J9/4 resonance and still have low eccetrcities (e < 0.14). On the other hand, there are bodies, which stay captured inside the resonance for hundreds Myr. Moreover, we can observe 190 Myr capture of one particle in 8J-3S-3 resonance (increasing its eccentricity by 0.02) and several shorter captures in 12J-2S-5 resonance.
 |
 |
Figure 2 - Evolution of proper semimajor axis, eccentricity and sine of inclination for 50 TPs with R = 3 km (the same particles as in Figure 1). Approx. 10 particles seem to be affected by the z1 resonance and exhibit periodic oscillations and increase of eccentricity, while drifting in semimajor axis.
| run | R / km | H / mag | t / Myr | NTP | initially below J9/4 | crossed (e < 0.14) | not yet entered | still inside | ratio crossed/below |
eos-j94_8 |
15.0 | 10.5 | 0 | 50 | 40 | 6 | 0 | 0 | 0.150 |
eos-j94_7 |
12.0 | 11.0 | 1150 | 25 | 15 | 1 | 0 | 0 | 0.067 |
eos-j94_7 |
10.5 | 11.3 | 1150 | 25 | 23 | 3 | 0 | 0 | 0.130 |
eos-j94_1 |
9.0 | 11.6 | 760 | 50 | 29 | 7 | 0 | 0 | 0.241 |
eos-j94_2 |
7.5 | 12.0 | 920 | 50 | 36 | 10 | 0 | 0 | 0.278 |
eos-j94_3 |
6.0 | 12.5 | 1400 | 50 | 30 | 9 | 0 | 0 | 0.300 |
eos-j94_4 |
4.5 | 13.1 | 870 | 50 | 36 | 17 | 0 | 0 | 0.472 |
eos-j94_5 |
3.0 | 14.0 | 600 | 50 | 35 | 19 | 0 | 0 | 0.543 |
eos-j94_6 |
1.5 | 15.5 | 446 | 50 | 32 | 19 | 0 | 0 | 0.593 |
Table 1 - Summary of J9/4 resonance crossing analysis. For each run we list: radius R of TPs, corresponding absolute magnitude H (for mean albedo 0.125), time-span t covered by the numerical integration so far (most of the jobs are still running), total number NTP of particles in this run, number of TPs (NTP), which were initially below the border of J9/4 resonance (actually, we originally intended that all TPs are below the resonance, but guessing their values of the osculating elements it sometimes happened, that TPs were in J9/4 initially), NTP crossing the resonance with e < 0.14 (obviously, we count only TPs that were initially below J9/4), NTP, which did not enter the resonance yet, NTP staying in the resonance at the end of integration and finally ratio of bodies crossing on low e to all bodies entering the resonance (ie. the 7th column of the table divided by the 6th). A comparison of the latter ratio with the observed distribution of family members on the left/right side of the resonance is on the Figure 6.

Figure 3 - Semimajor axes a and absolute magnitudes H of Eos family members (HCM at 100 m/s). The blue "envelope" denotes the maximum theoretical distance (in a), which asteroids (of given H, ie. size) could drift by the Yarkovsky effect (it corresponds to the approximate age of 2 Gyr; here we assume that the initial collisional distribution in a was small). It is empirically centered at 3.02 AU in order to get a good match of the bulk of the known family members with H between 10-14. Notice the (black) bodies located 0.02 AU behind the right branch. It might be caused by jumps over the J9/4 resonance, which effectively increase the drift, but the width of J9/4 is 0.01 AU only; as an alternative possibility, these smaller bodies might have been initially distributed in a, so that they did not start drifting from 3.02 AU. At small values of a we cannot see them, since J7/3 likely removed most of those that reached its zone - we are actually going to verify this important hypothesis by running similar jobs as we are reporting here for J9/4. More information about this figure is avaiable on the WWW page: Call for observations of the possible Eos interlopers.

Figure 4 - Eos family members, in (a, e) plot, as they are identified by HCM method at the cutoff velocity 80 m/s. Notice the distribution of members' eccentricities just on the left and right side of the J9/4 resonance, which seems to be quite similar, while at 60 m/s there is significantly smaller dispersion in the right cloud (with lower upper border). Based on the AtsDys catalogue of proper elements. See also: Figure 7; Eos family at different cuttof velocities.
Figure 5 - Comparison of left and right side of J9/4 resonance. The red line shows number of bodies (of given absolute magnitude H) observed on the right side of the resonance, divided by the number of bodies on the left side; note, that we count only those inside the blue "Yarko envelope" of the family. The green line denotes a theoretical population of bodies originated at 3.02 AU and moved by Yarkovsky force during 2 Gyr time-span. If the diurnal variant of the Yarko-effect dominates (and there are no reorientations of the spin axis), the population after 2 Gyr should uniformly fill the corresponding V-shaped Yarko zone in the a-H plot. Reorientations and/or initial collisional distribution of the ejecta in a cause that the density of the population in the Yarko-envelope would not be exactly uniform, but would have maximum in the centre - DV may run his MC code to get this density distribution; for this moment we assume simpler uniform distribution. Note that we anyway have less bodies on the right side of J9/4, and this is because J9/4 is slightly offset from the center of the Yarko zone. The shapes of both lines are in a good agreenment, but the real observed population on the right side is still smaller. This might be a result of interaction of asteroids drifting via Yarkovsky effect with the J9/4 resonance. See following discussion below Figure 6. [ data | GIF | EPS | PS ]
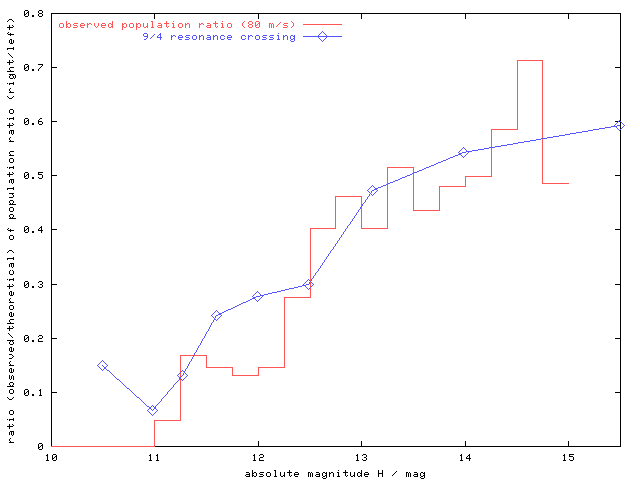
Figure 6 - Comparison of population on the left/right side of J9/4 resonance and its crossing probability. The red line is a ratio of right/left observed population and theoretical (Yarkovsky moved) right/left population (ie. it is the same as the red line divided by green line on Figure 5. The blue line is a fraction of test particles (of given H), which crossed the J9/4 resonance on low eccentricity in our numerical simulations (each blue point is a result of one run eos-j94_*). Approx. 50 - 90 % of bodies, depending on their absolute magnitudes (ie. diameters and drift rates) are eliminated by the J9/4 resonance; their eccentricities become higher than 0.14 and thus these bodies cannot be further identified with the Eos family. [ data | GIF | EPS | PS ]
The H disribution on the observed right/left-side asteroids as refered to the theoretically uniform distribution surprisingly well matches the probability, that an asteroid (of this H) could cross the J9/4 resonance. This strongly supports the hypothesis of originally compact asteroid family (with dispersion of semimajor axes 0.01 AU, at least up to magnitude ~14-15), which slowly dispersed by Yarkovsky effect (actually the data strongly support the argument that the relative paucity of asteroids on the right side of J9/4 is caused by drifting through J9/4; Yarko-effect seems to be the only dynamical effect at hand to cause such systematic flow). Note that the Yarko-zone on the right side of J9/4 goes down to some ~9th magnitude; these large bodies drifting outwards (to the right) were eliminated by interaction with J9/4 resonance - actually we are now going to run 50 TPs with R=15km to fully verify this conjecture.
Figure 7 - The eccentricity distribution of our test-bodies moving through the J9/4 resonance compared with the observed distribution of the Eos members (at 80 m/s cutoff) on the left and right sides of the resonance. There is no significant shift in eccentricity distribution of TPs (between eccentricity values 0.02 - 0.15) after crossing the resonance. A substantial part of TPs may gain higher eccentricies 0.15 - 0.25 (and thus they cannot be identified with the family, even at 120 m/s cut-off). However, only 20 % of these bodies will stay there for a long time (the rest is still under influence of J9/4 resonance, which is wider in a at higher eccentricites). Observed family members (cyan and magenta plots) on the right side of the J9/4 resonance reveal slightly lower mean eccentricity, than those on the left side (between 3.0 and 3.029 AU). [ data 1, 2 | GIF | EPS | PS mono ]
Figure 8 - Dependence of proper eccentricity change on the corresponding residence time inside the J9/4 resonance (for purposes of this analysis we choose its borders arbitrary 3.026 and 3.033 AU) The longer time a TP moves inside the resonance, the larger might be its change of eccentricity (either positive or negative). The mean value of eccentricity change is de = 0.03. [ data | GIF | EPS | PS mono ]