Blackbox :: Observations versus N-body simulations (of Eos)
BLACKBOX is a simple tool which can be used
to rigorously compare observations of asteroid families to the
respective N-body simulations. First, we select observed asteroids
according to their colours (or albedos). Second, we account for
a background population. Third, we match the synthetic size-frequency
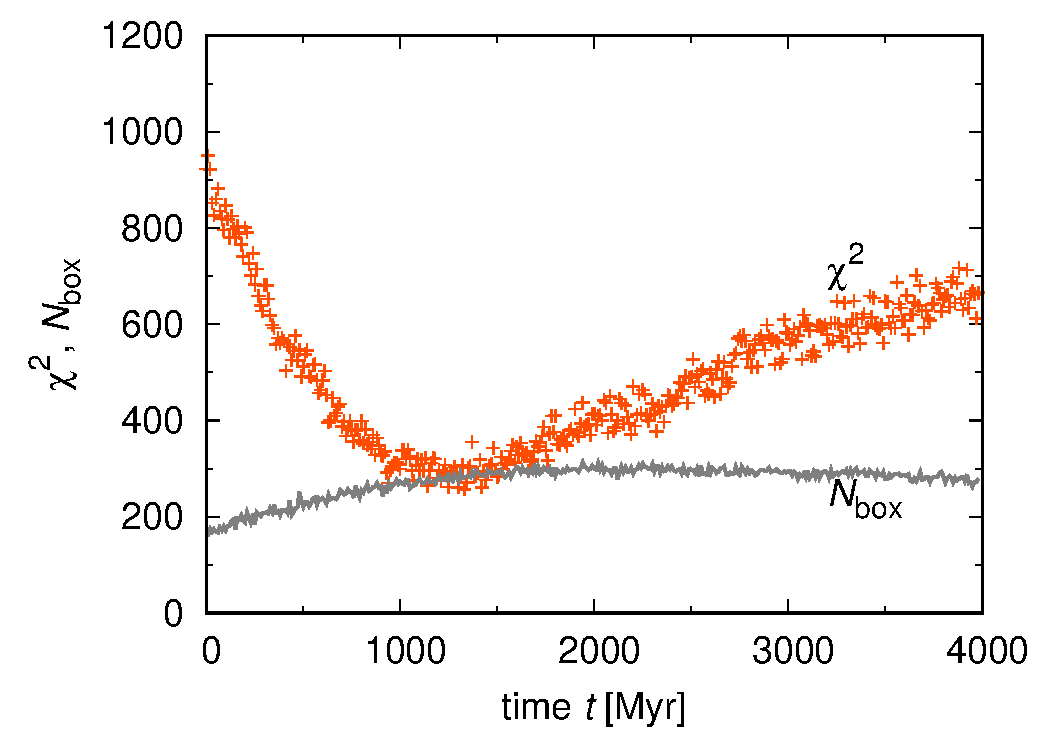
distribution to the observed one. Finally, we compute a suitable
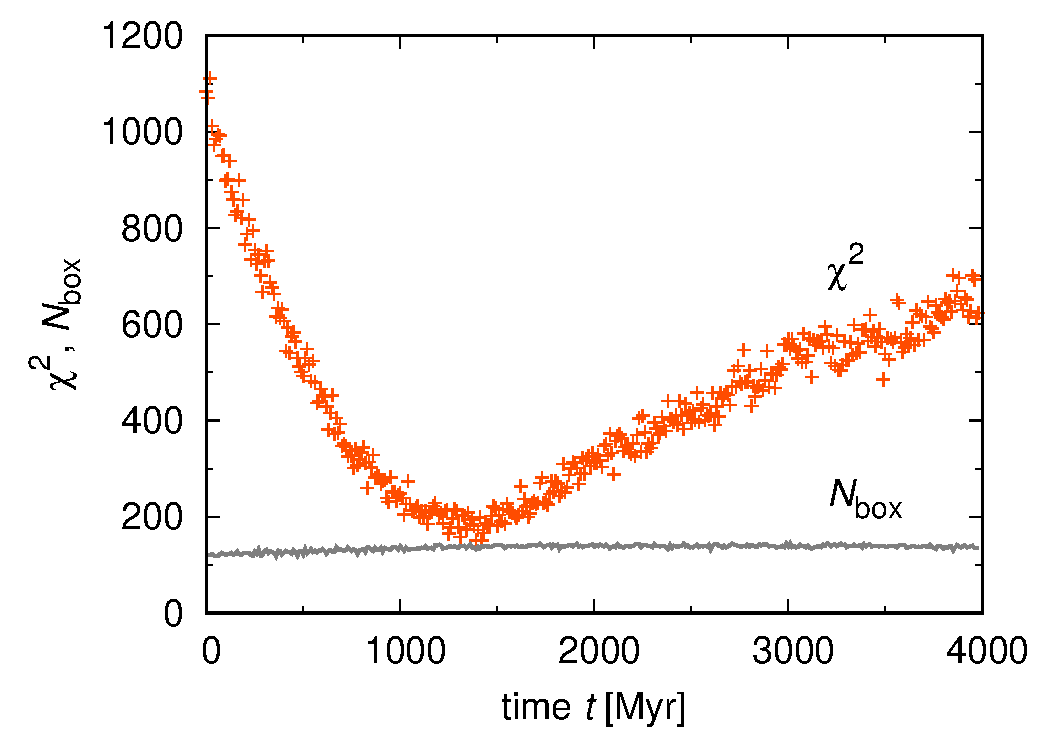
χ2 metric, and determine both lower
and upper limits for the age.
  eos2.pdf              ... (revised) manuscript
  blackbox.py           ... Python script to compare observations to the N-body simulation
  blackbox_PALLAS.py    ... script adapted for the Pallas family
  Ktypes.tar.gz         ... observational data
  background.tar.gz     ... dtto
  eos-5_blackbox.tar.gz ... synthetic data (Swift N-body simulation)
 |
versus
|
 |
|
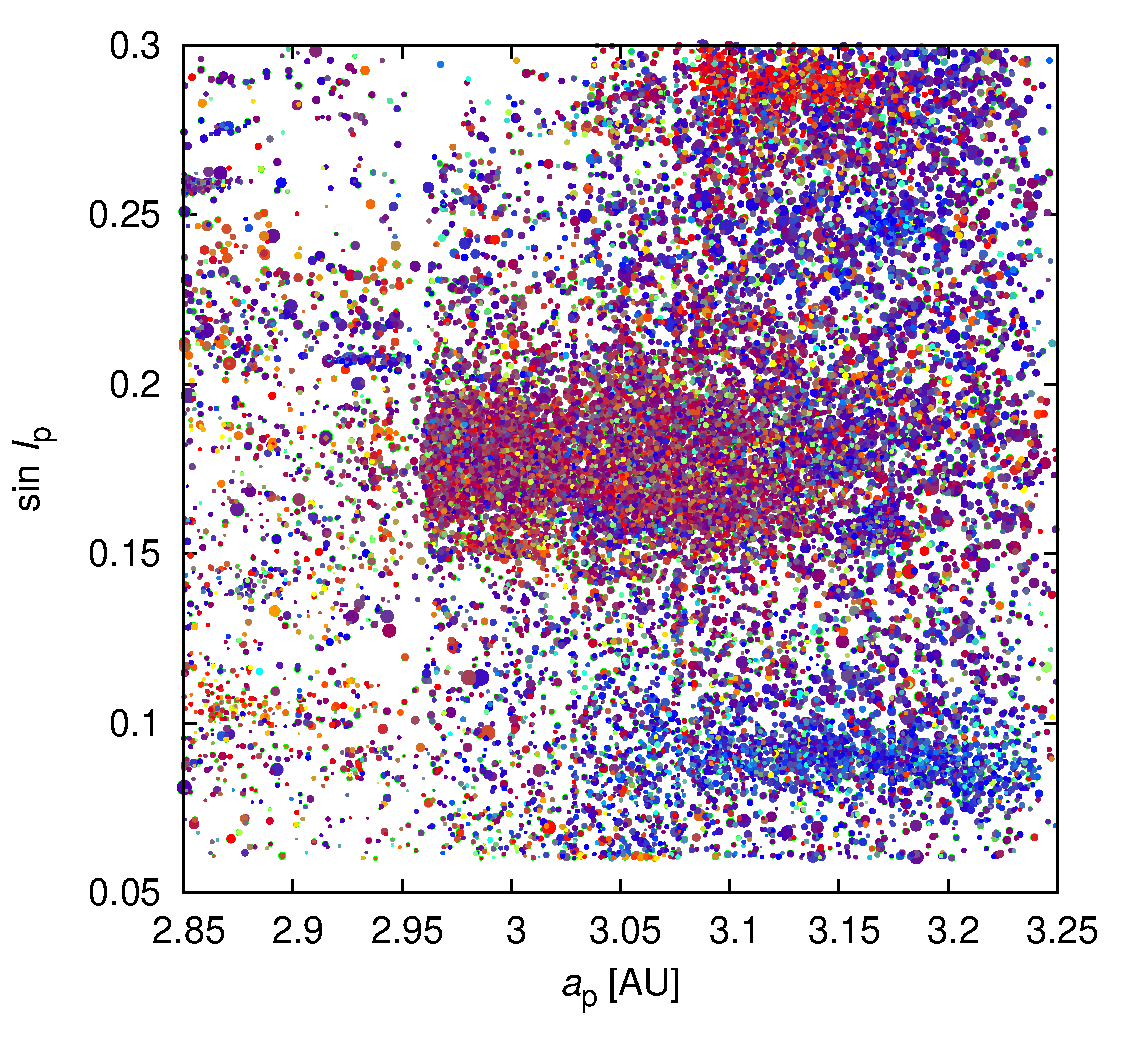
Figure 1 ― Left panel:
the proper semimajor axis ap vs proper inclination sin Ip
for all asteroids in the broad surroundings of Eos family.
The range of proper eccentricities is ep = (0.0; 0.3).
If they have colour data in the SDSS MOC4 catalogue (Parker et al. 2008),
the colours correspond to indices a*, i‒z
which are closely related to taxonomy,
namely blue is close to C-complex taxonomy,
red to S-complex,
and magenta to K-type.
The whole sample contains 18 471 asteroids.
There are other prominent families visible:
Hygeia (C-type, bottom-right),
Veritas (C, next to Eos),
Tirela (S, upper right),
Telramund (S, below Eos);
a close inspection would show 32 families in total!
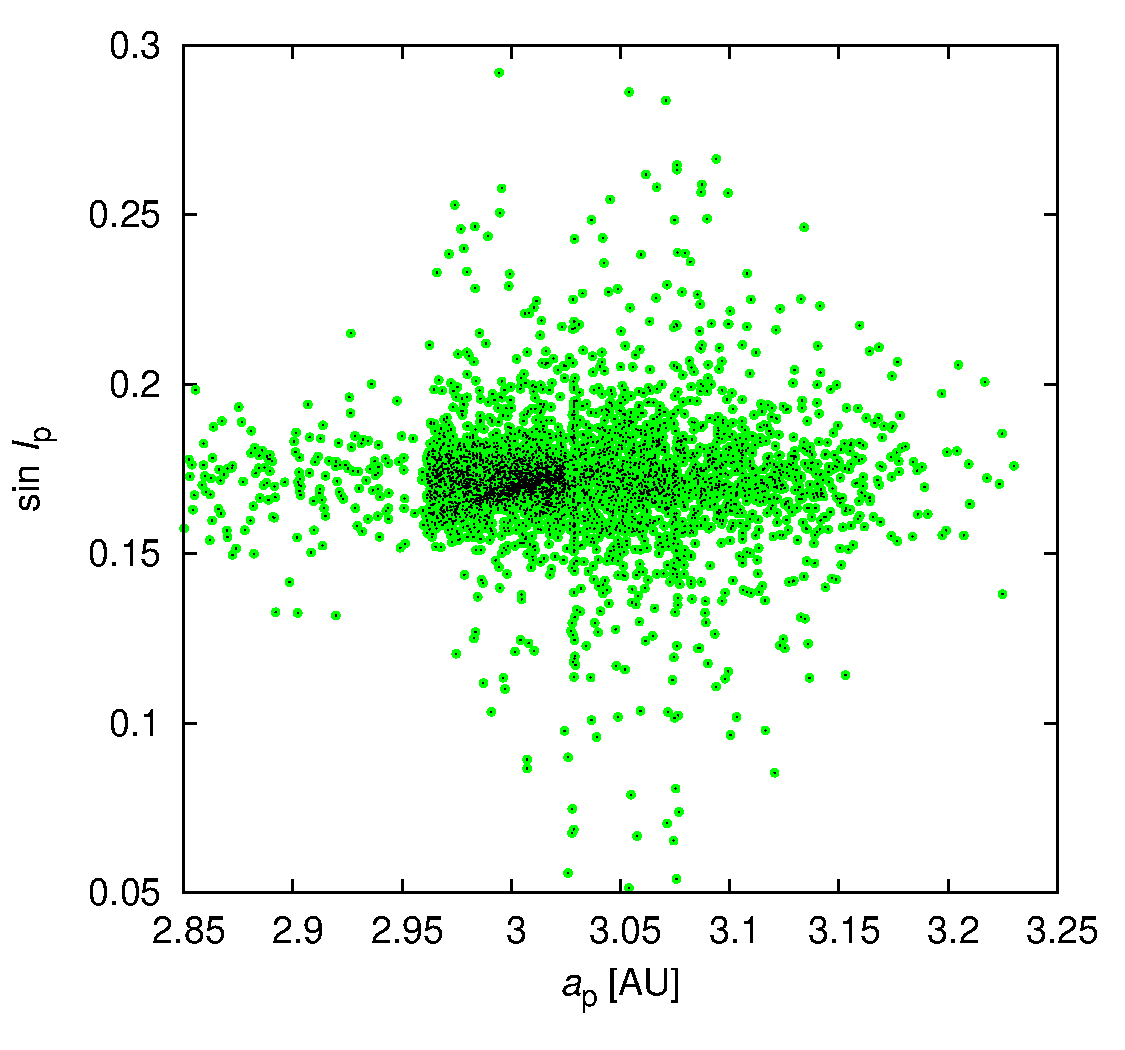
Right panel:
the same plot for a typical outcome of N-body simulations,
assuming a disruption of a parent body,
ejection of fragments with some velocity field,
and their long-term dynamical evolution due to
gravitational perturbations,
resonances,
chaotic diffusion,
the Yarkovsky effect,
the YORP effect, etc.
The two panels are not directly comparable.
|
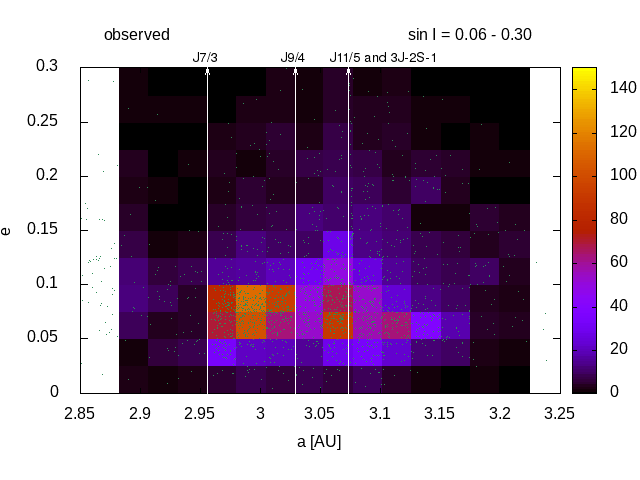
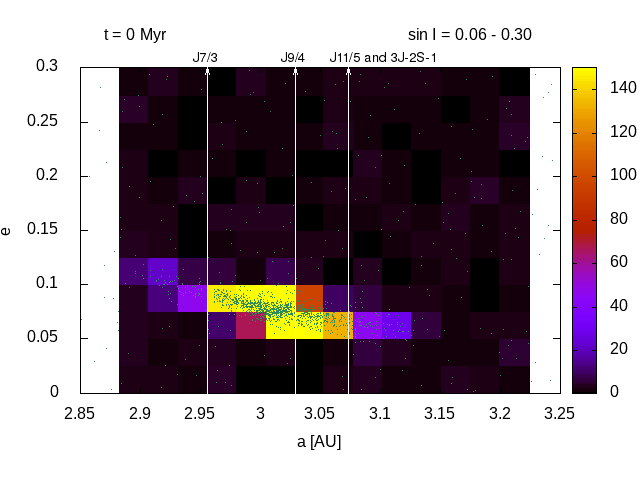
Supporting material
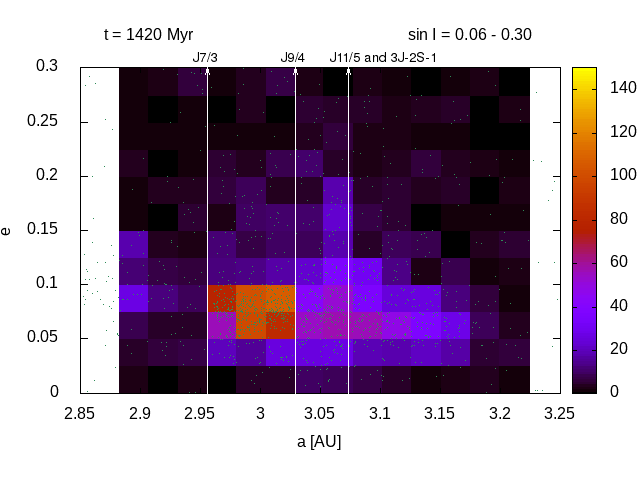
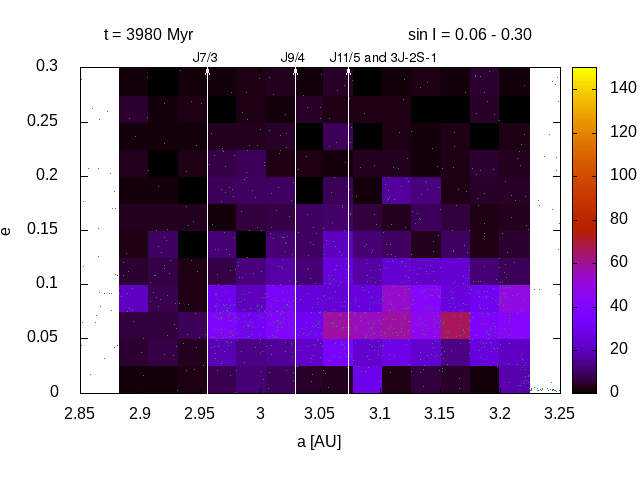
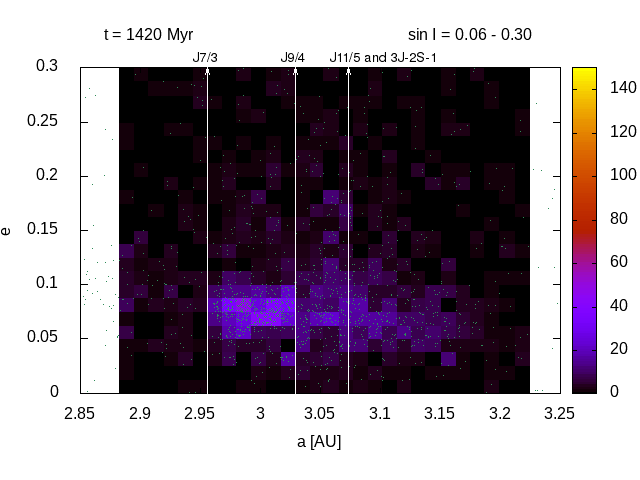
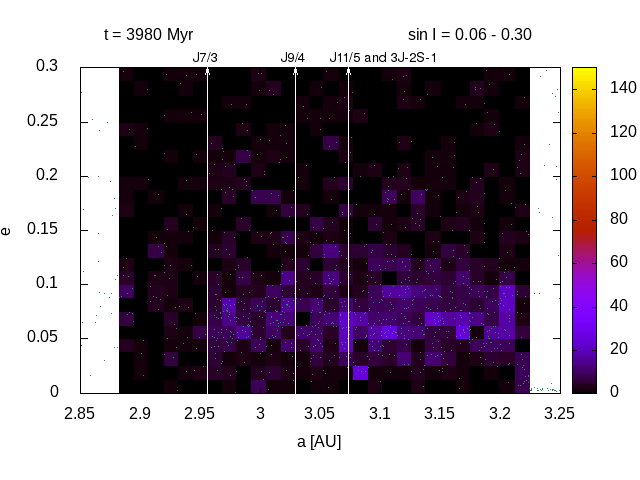
(ap, ep) plots:
| observed (SDSS) |
t = 0 |
|
1420 Myr |
|
3980 Myr |
 |
 |
→ |
 |
→ |
 |
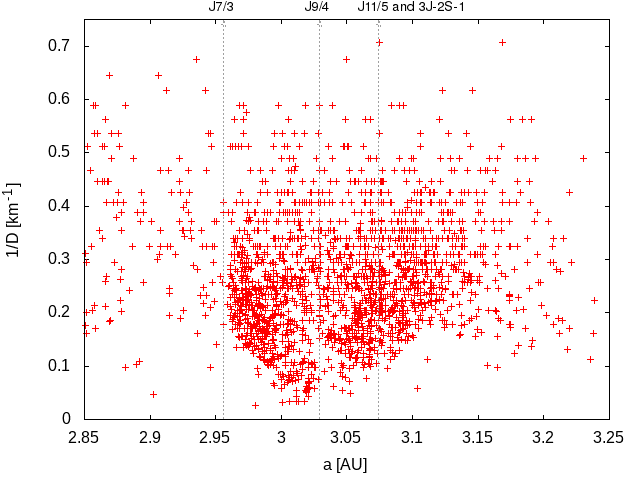
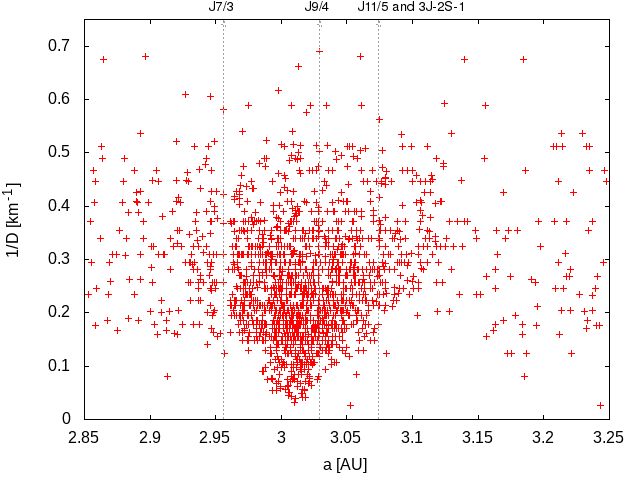
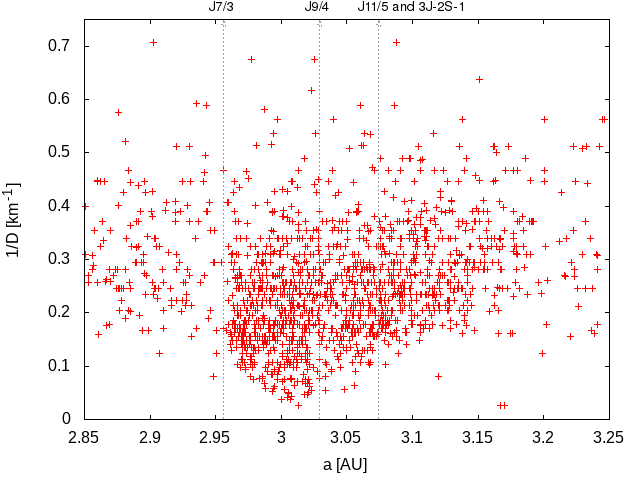
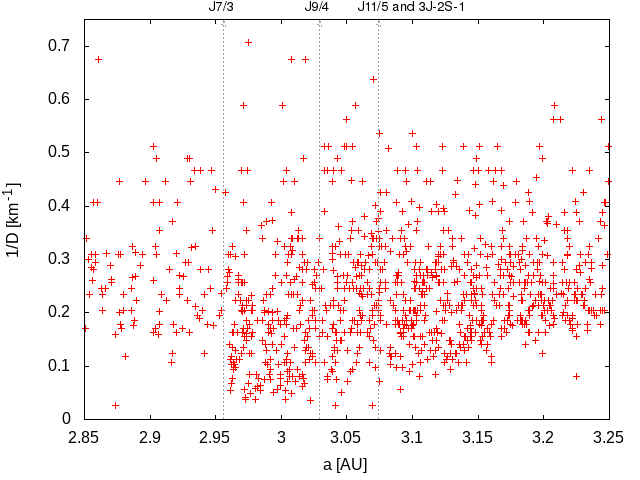
(ap, 1/D) plots a.k.a. 'V-shapes' ← not fitted in this method:
| observed (SDSS) |
t = 0 |
|
1420 Myr |
|
3980 Myr |
 |
 |
→ |
 |
→ |
 |
χ2 vs time t for the nominal simulation:
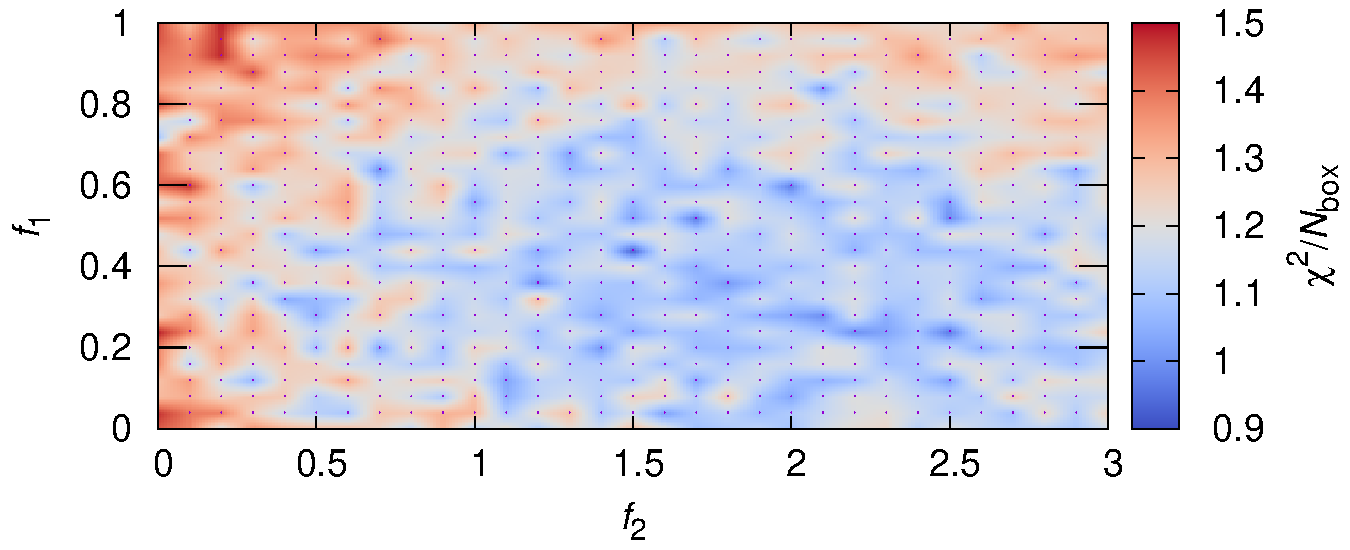
χ2 dependence on f1, f2 factors used to scale background below and above J7/3 resonance:
a comparison of (ap, ep) plots
and χ2(t) computed with 2× smaller box sizes:
| observed (SDSS) |
t = 0 |
|
1420 Myr |
|
3980 Myr |
 |
 |
→ |
 |
→ |
 |
 |
Miroslav Brož (miroslav.broz@email.cz), May 14th 2018